
Dwight Taylor
CEO & Chief Tableau & Power BI Solutions Architect
Dwight is the founder and CEO of VIZYUL LLC, a practice with solutions that help companies maximize Tableau and Power BI investments through training, implementation and support.
With 20 years of business intelligence experience, and a high competency level across many different technology domains, Dwight has extensive experience working with C-Level executives, decision makers and managers and enough the hands-on experience to actually “do the work”.
Partial List of Professional Strengths/Accomplishments
- Published Op-ed Author – http://analytics-magazine.org/power-bi-vs-tableau/
- Extensive experience communicating effectively with executive leadership on BI and self-service enterprise strategy, platform integration, security and adoption.
- Communication and bridge builder between IT and business partners.
- Power BI – Expert Level – More than 18 years of experience with the full Microsoft technology stack, including Power BI and all of the technology enablers for the platform.
- Tableau – Expert Level – Certified and broad experience deploying Tableau at Fortune 500 & 1000 companies.
- Microsoft SharePoint – Expert Level – 14 Year’s Experience, started the very first SharePoint
- Technical Support web site in 2001
- (https://web.archive.org/web/20030604161415/http://tsc.webrevel.com/)
- Microsoft SQL Server – Expert Level – More than 16 years of, deployment, management and hands on development.
- TeraData – Expert Level – More than 10 years of experience. Played a stakeholder role in designing and building the very first Enterprise Data Warehouse at the fourth largest health insurer in the US.
- Javascript – Expert Level – More than 18 years of experience.
Power BI Dashboard Example
Tableau Dashboard Examples
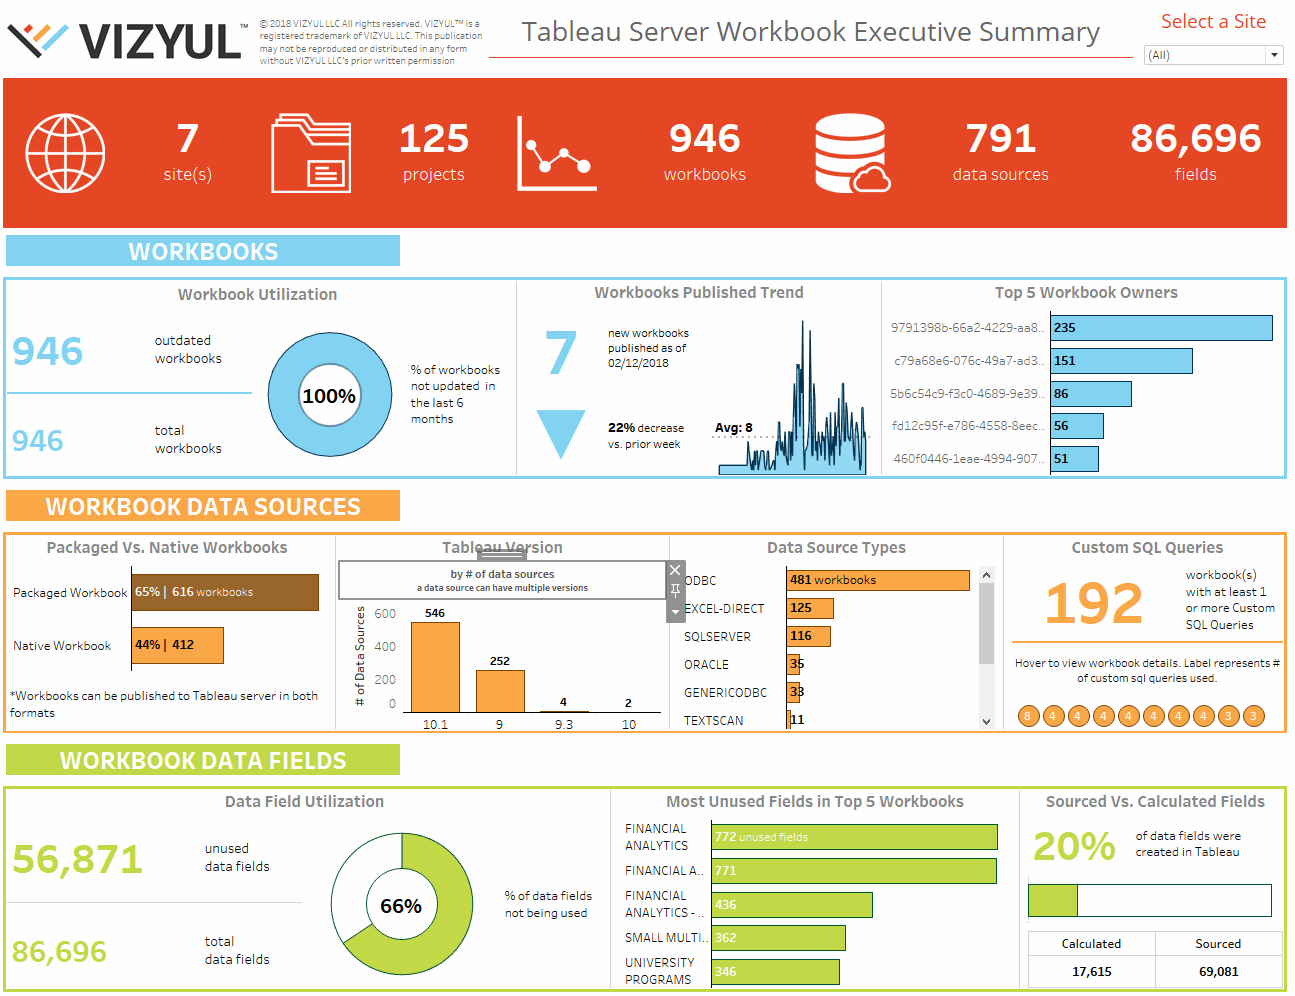
VIZYUL™ Analysis Dashboard
The following is the Executive Summary dashboard from our proprietary Tableau Server deep analysis software. For more information about VIZYUL™ software, contact a VIZYUL LLC representative.
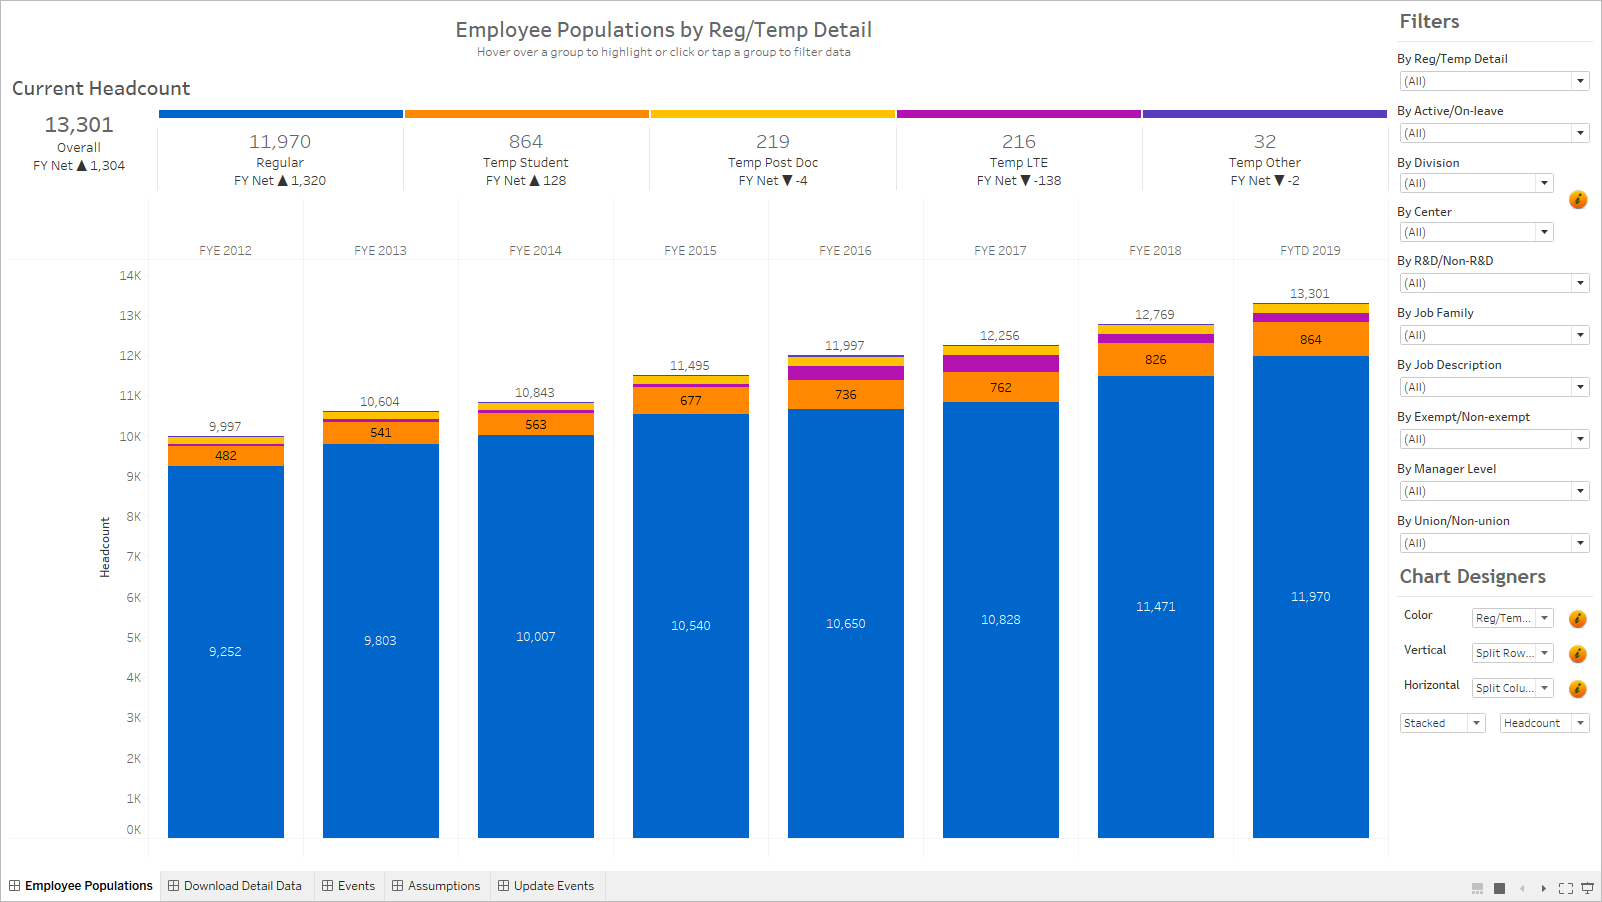
Employee Population Interactive Dashboard
The following screenshot is an interactive corporate workforce dashboard developed for HR professionals. Using the interactive dashboards, HR professionals can slice and dice trend and year-to-date staffing levels. The dashboard also has a configurable categorical setting for both the X and Y axis.
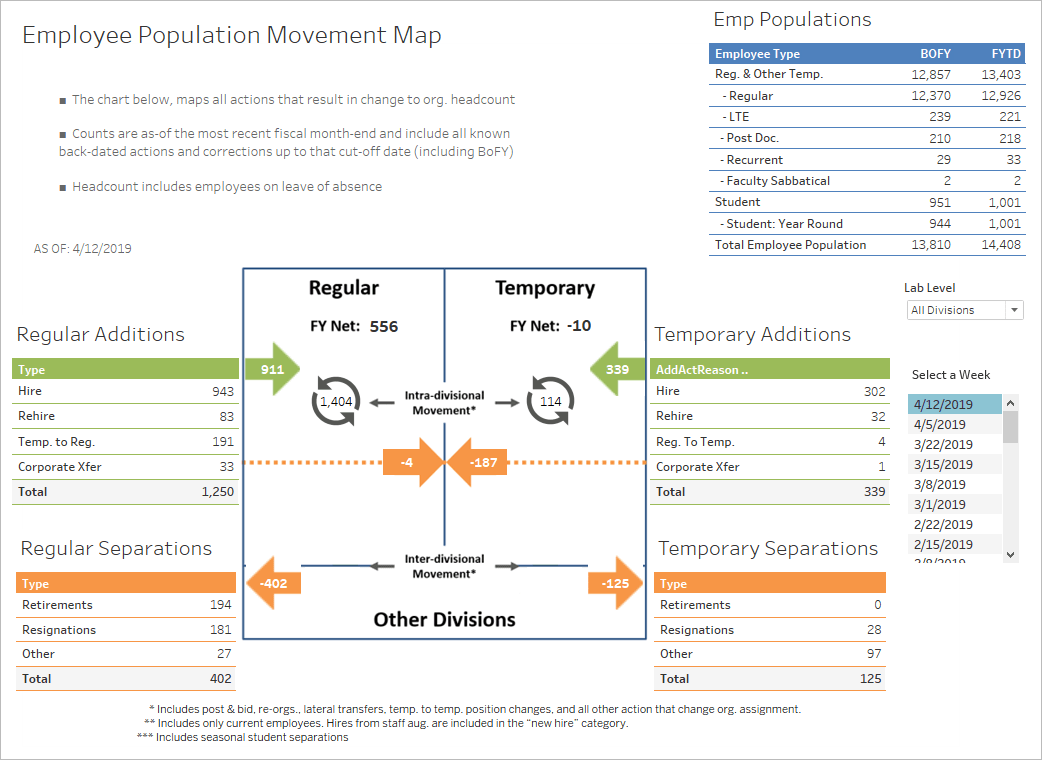
HR Staff Movement Dashboard
The following screenshot is a drillable Tableau dashboard that provides HR professionals insight Into interdivisional staffing changes, including the ability to narrow the analysis to single divisions. The dashboard also provides HR professionals with weekly incremental snapshots of staffing updates.
Experience
EC-United/Cook County Health
Chicago, IL.
Jan 2021 – Present
AWS & Tableau Solutions Architect Consultant
- Design a serverless microsite architecture capable of handling 10,000+ vaccination interest form submissions per second
- Partnered with AWS and CloudFront regional engineers to certify the application architecture against performance and resilience goals
- TECHNOLOGY STACK
- AWS WAF (Firewall)
- CloudFront
- AWS Amplify
- S3 storage
- React/Redux
- GraphQL
- AWS DyanmoDB
- WAS RDS (Microsoft SQL Server)
- Twilio
- Tableau Online
- SendGrid
- Constant Contact
- TECHNOLOGY STACK
- Designed internal interactive Tableau dashboards to facilitate patient and vaccination search capabilities and to amplify cognition of regional vaccination campaigns
- Conducted weekly war-rooms for vaccination distribution
The MetroHealth System
Cleveland, OH
Nov 2020 – Present
Tableau Solutions Architect Consultant
- Upgrade Test and Production Tableau server clusters
- Design Enterprise Strategy for publishing Tableau content from POC to QA and then into the Production environment using the Tableau Content Migration Tool
- Optimize performance and interactivity of existing workbooks
- Implement incremental extracts to preserve historical Tableau server metadata repository
- Perform 2 week Tableau server baseline assessment using proprietary VIZYUL™ software
Village of Skokie
Skokie, IL
Oct 2020 – Present
Power BI Solutions Architect Consultant
- Configure and secure Power BI Service
- Migrate existing Tableau workbooks to Power BI reports
- Conduct four-day comprehensive Power BI training
- Build high performance Power BI reports with sub-second responsiveness
Discovery Health Partners
Itasca, IL
Oct 2019 – Jan 2020
Power BI Solutions Architect Consultant
- Design Enterprise Strategy to enhance Executive Leadership Team reporting from SQL Server Reporting Services paginated reports to interactive and engaging Power BI reports and dashboards.
- Design Enterprise Workspace architecture for new Power BI Service tenant.
- Design Enterprise Grade data architecture for new Power BI Service.
- Conduct Enterprise Reporting Gap Analysis from business unit leaders.
- Gather and document requirements for Enterprise Power BI reports, data sets and dashboards.
- Design drill-through and drill-down enabled interactive, engaging and insightful Power BI reports and dashboards.
- Conduct Enterprise-Wide Power BI training for information consumers, Power BI developers and Power BI administrators.
Healthcare Service Corporation
Chicago, IL
May 2017 – Dec 2019
Tableau Solutions Architect Consultant
- Defined the transition strategy from a complex Excel application to an automated Tableau dashboard solution.
- Designed the architecture to automate the acquisition of manual data sources to be presented via Tableau dashboards.
- Conducted comprehensive Tableau training sessions focused on optimizing SQL Server data sources.
- Provides the Treasury team with ongoing support for Tableau Desktop 10, SQL Server 2012 and Enterprise Scheduling tools.
- Designed interactive dashboards for daily investment and cash position Treasury meetings.
Sandia National Laboratories
Albuquerque, NM
Mar 2017 – May 2017
Tableau Solutions Architect Consultant
- Conducted 4-day comprehensive Tableau instructor-led training session.
- Conducted 4-day comprehensive Power BI instructor-led training session.
- Partnered with Sandia IT Administrators to recover a failed upgrade migration from Tableau Server 10.4 to Tableau Server 2018.1 and then to Tableau Server 2019.1.0.
- Defining a migration strategy of 150+ SSRS reports to Power BI Desktop (August 2018 Release) and Power BI Server (on-premise August 2018 Release)
- Used VIZYUL LLC’s proprietary software, VIZYUL™, to analyze Tableau Workbooks created by former Sandia Tableau Consultants. Delivered an interactive dashboard used by Tableau stakeholders to create action plans for the analyzed Workbooks.
- Worked with Sandia Tableau stakeholders to established requirements and design specifications for three designated reports.
- Designed and built three interactive dashboards capable of answering multiple layers of analytic questions on a given subject.
Alliant Credit Union
Chicago, IL
Jul 2018 – Nov 2018
Tableau Solutions Architect Consultant
- Architected and installed a brand new 3-node Tableau cluster from the ground up. Partnered with various Alliant technology teams to lead the Tableau server build out.
- Designed a Tableau implementation strategy ideal for high adoption rates and that organically identified Tableau Ambassadors.
- Designed a redundant and highly available Tableau cluster architecture with Active Directory integration.
- Developed Tableau Central, a centralized hub for all things Tableau; self-paced training materials, Tableau support discussions, semantic layer documentation for certified data sources, etc…
- Identified high value success stories to boost Tableau adoption.
JLL
Lombard, IL
Jun 2016 – Feb 2017
Tableau Solutions Architect Consultant
- Used VIZYUL LLC’s proprietary software, VIZYUL™, to assess JLL’s existing Tableau platform, which included all Workbooks and Data Sources in the Tableau server and Workbooks on corporate file shares.
- Delivered an Enterprise Readiness Strategy roadmap from 2017 through 2019
- Expanded Tableau server from a single server to new VM four server Tableau Highly Available and Redundant cluster.
- Executed for following instructor led training for the Self-Service BI team
o Tableau Desktop I
o Tableau Desktop II
o Tableau Server I
o Tableau Server II
- Conducted Lunch & Learn sessions twice a week to introduce Tableau users to best practice Tableau Design techniques in the Americas, Europe and Asia Pacific.
Grainger
Chicago, IL
Feb 2016 – Jun 2016
Tableau Solutions Architect Consultant
- Partnered with Grainger BI stakeholders, Data Warehouse owners, networking, infrastructure and security leaders to deploy the first Tableau 16 Core Cluster.
- Implemented a full self-service data visualization model for Grainger to execute.
- Trained Tableau Server Administrators and business Tableau Champions.
- Implemented a new Tableau Server tenant onboarding program.
- Implemented a post-production Tableau resource model. VIZYUL LLC also placed a Senior Tableau Designer team member onsite at Grainger with a contract thru December 2017.
Intuit
San Francisco, CA
Sep 2015 – Dec 2015
Tableau Solutions Architect Consultant
- Partnered with KPMG to develop, test and deploy 5 operational dashboards to the Intuit IT team to monitor Help Desk Ticket management.
- Implemented a distributed Tableau resource model. VIZYUL LLC placed a Tableau resource onsite at Intuit with full time Tier 1 support from Dwight Taylor for the duration of the project.
Cars.com
Downtown Chicago, IL
Nov 2014 – Sep 2015
Tableau Solutions Architect Consultant
- Successful project rescue of a six week Tableau POC project. Joined the project midway thru the six week engagement.
- Partnered with consultants to architect and deploy a distributed five node Tableau server cluster with 5 Tableau sites, 15,000+ users and 2,000+ external Cars.com dealers.
- Successfully led the conversion of 24 customer facing dashboards from Business Objects to Tableau.
- Trained two junior Tableau resources to assume post-production design and maintenance.
Zurich North America
Schaumburg, IL
Apr 2014 – Oct 2014
Tableau Solutions Architect Consultant
- Successfully rescued a six week Tableau POC project. Joined the project midway thru the six week engagement where half the budget was burned through and the current Tableau resource was recently released from the project.
- Authored and presented Tableau dashboards to the CEO, CFO and Chief Actuary of Zurich North America. Successful POC rescue resulted in a new 12 week engagement to promote successful POC work to alpha phase.
- Worked with Zurich North America Actuarial Managers to develop presentation ready Tableau Storyline templates.
- Worked with Zurich North America IT staff to automate data refresh schedules for Tableau workbooks.
Salesforce.com
Indianapolis, IN
Feb 2014 – Mar 2014
Tableau Solutions Architect Consultant
- Developed user and technical data visualization requirements for a Benchmark study on product performance for the Marketing team.
- Authored a comprehensive Tableau dashboard spanning eight different data sources across four lines of business that allows the Marketing team to visually see product performance on an ongoing basis.
- Developed user and technical data visualization requirements for two operational Tableau Dashboards for the Product Operations team.
- Authored a Tableau dashboard that enabled the Product Operations team to monitor the performance and health of its mail transfer agents in real-time.
- Authored an enterprise wide Tableau dashboard that enabled the Product Operations team to proactively monitor server hardware availability.
- Authored a Tableau dashboard that enabled the Product Operations team to historically analyze its mail transfer agents for future capacity planning.
Healthcare Service Corporation
Chicago, IL
1996 – 2013
Principal Tableau Consultant (2012 – 2013)
- Coordinated a 100+ end user/ $300K corporate-wide Data Visualization and Rapid Fire Analytics initiative adding Tableau to existing business intelligence enterprise infrastructure.
- Led a Tableau Dashboard Proto-typing partnership with stakeholders from the Information Management, Marketing, Client Reporting, Desktop Support and Information Technology divisions.
- Managed the design of an Executive Benchmark Dashboard, using Tableau to replace the manual labor of five full-time staff.
- Managed four progressive levels of Tableau training for more than 50 users.
- Led the corporate-wide technology assessment process for the approval process of Tableau Desktop and Server.
- Delivered innovative Tableau conference sessions at two Tableau Conferences and a session at the Chicago Tableau User Conference held at Concordia University.
Business Intelligence Manager (2005 – 2011)
- Managed a team of 25 full-time staff and 10 contractor resources with a $3.5 mil yearly budget.
- Managed a $10 mil analytics transformation project from Crystal Reports/SQL Server to COGNOS/TeraData. Integral in the design of a new Datamart. 99% decrease in quarterly report runtimes.
- Managed the training and development of COGNOS bi developers.
- Managed the development of the most comprehensive client-facing performance dashboard on the COGNOS platform at the time of its release.
Business Intelligence Supervisor (2003 – 2004)
- Supervised a team of 4 full-time team data analysts.
- Played a key role in the development of an enterprise wide data modeling and data warehouse initiative.
- Led the development of SQL and Microsoft Access reports and data analysis
Data Analyst (1996 – 2002)
- Managed PARADOX application
- Designed departmental Microsoft Access application solutions
- Performed data analysis using SQL against TeraData enterprise data warehouse