
Tableau Dynamic Dimensions
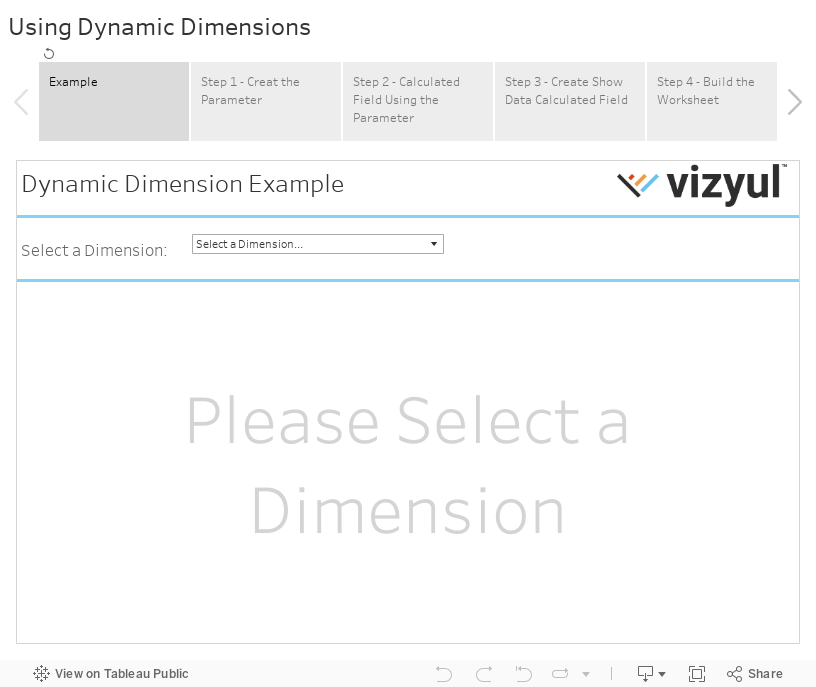
Ever wished you could change the dimension in a chart on a dashboard? Ever wanted to give viewers the ability to slice the data by the dimension of their choice? Well, Dynamic Dimensions may the solution for you.
Dynamic Dimensions add space-saving and user experience benefits that allow viewers to slice and dice data in exciting new ways. We used the Superstore Sales data set for this example.
Don’t want to read create it yourself, click here to jump to a live version at the bottom of the screen. When you’re ready, navigate through the Story Points for step-by-step design instructions. You can also download the Workbook to see how it’s done.
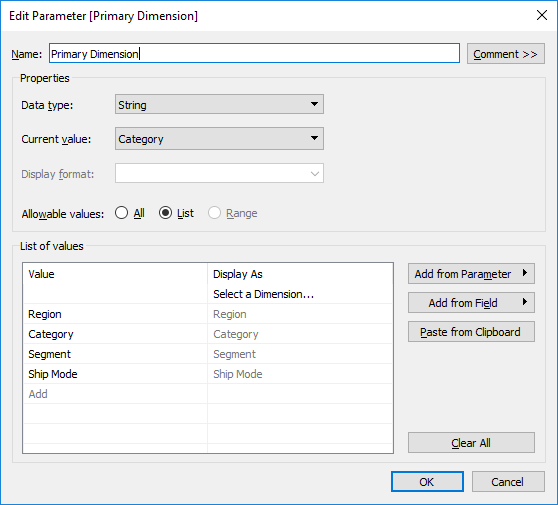
1. Create a new Parameter
- Create a new Parameter
- Use the string data type
- Choose List for Allowable values
- For the first item in the list, enter a single blank space ” ” (without the quotes) for value and “Select a Dimension…” for Display As
- Add a new row for each desired dimension
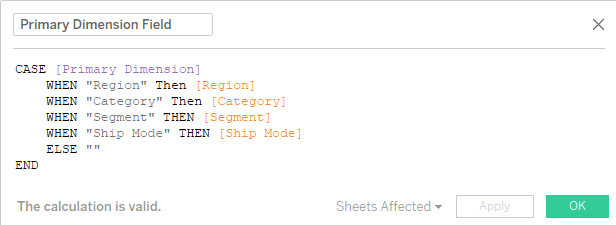
2. Create a Calculated Field Using the new Parameter
- Be sure each of the dimensions used have the same data type. If not, Tableau may report that the calculation is invalid. If you need to use a dimension that has a non-string data type, it may make sense to wrap the field in the STR() Tableau function. This function converts a value to a string.
3. Create a Show Data Calculated Field
- Create a new Calculated Field
- Define the calculation as follows
- [NAME OF THE NEW PARAMETER] <> ” “
- i.e. If you named your new parameter Pick a Dimension the calculation would be [Pick a Dimension] <> ” “
4. Build the Worksheet
- Drop the calculated field from Step 2 onto the columns shelf.
- Drop the measure of choice onto the rows shelf.
- Drop the Show Data calculated field from Step 3 onto the Filter shelf.
- Drop the calculated field from Step 2 onto the color shelf.
![]()